
Real-Time Portfolio Dashboard for Property Managers
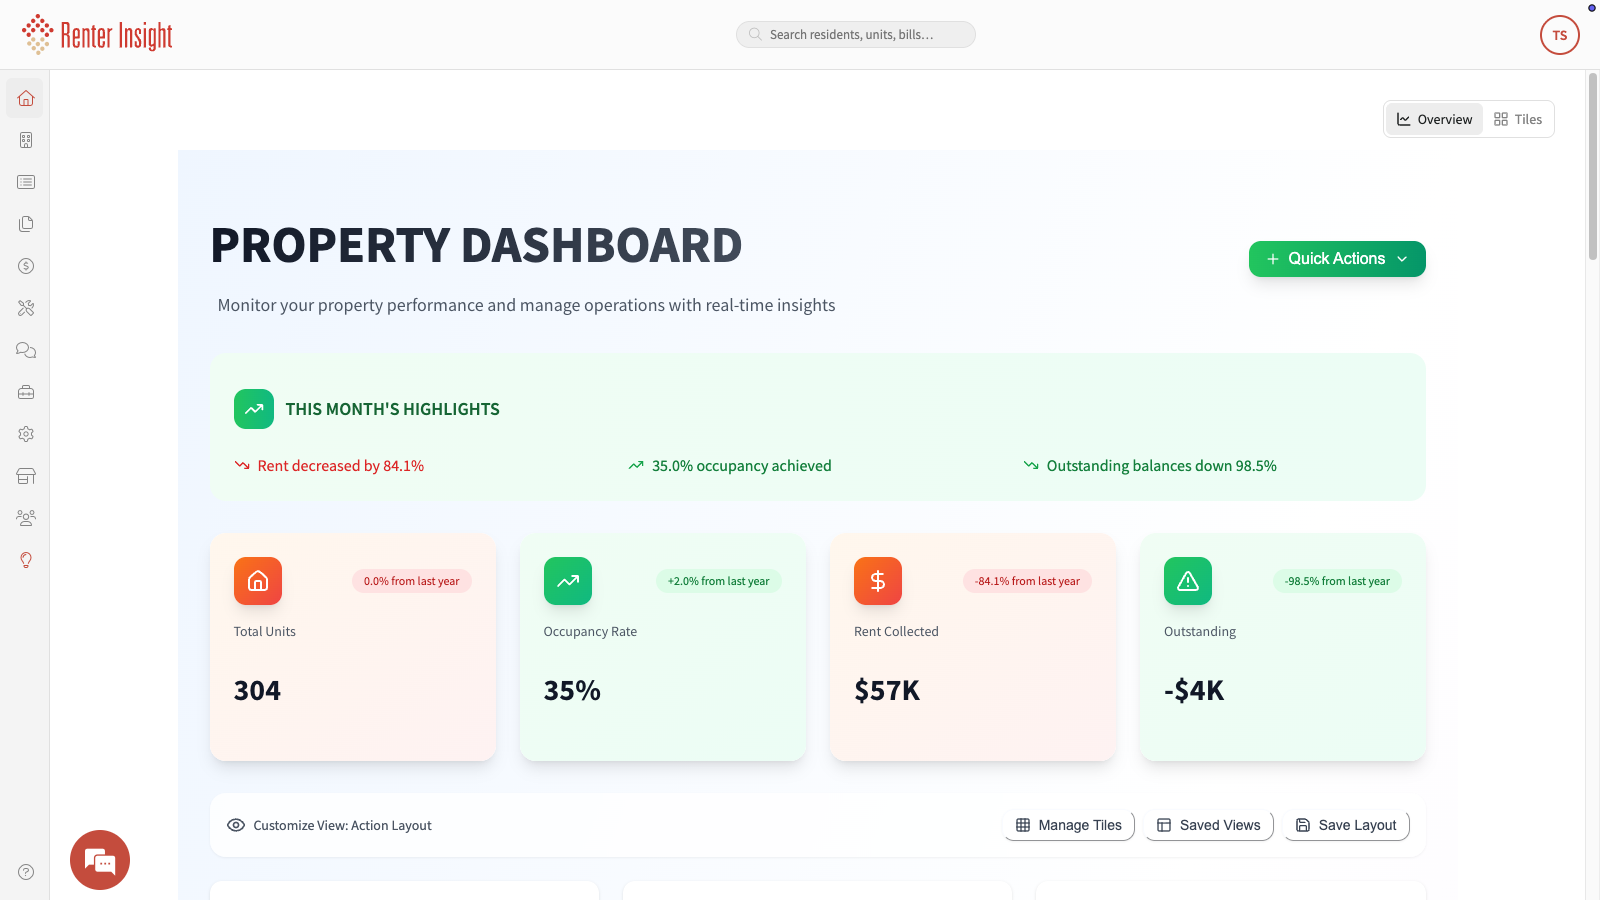
Tracking portfolio performance should not require pulling numbers from spreadsheets or chasing down reports. Renter Insight, a US-based property management software company, built its Property Dashboard so that every key metric is visible the moment you log in. The single most useful takeaway: you can see total units, occupancy rate, rent collected, and outstanding balances in one place, in real time.
What does the Property Dashboard actually show you?
The dashboard displays four core metrics at a glance: total units, occupancy rate, rent collected, and outstanding balances. Month-over-month changes are shown alongside each figure, so you can immediately tell whether performance is trending up or down without opening a single additional report.
To make this concrete, here is what the dashboard looks like with a live portfolio loaded:
- Total units: 304
- Occupancy rate: 35%
- Rent collected: $57,000
- Outstanding balances: tracked down to the dollar
- Month-over-month changes: visible next to each metric
Every one of those numbers updates in real time, so the view you see when you log in reflects what is actually happening across your portfolio right now.
Why does consolidating this data matter for portfolio operators?
Piecing together performance data from multiple sources costs time that most management teams do not have. When occupancy figures live in one place, rent totals in another, and balances in a spreadsheet, the process of building a clear picture becomes the job instead of acting on what that picture reveals.
Consolidating everything into a single dashboard changes that dynamic in a few practical ways:
- No manual report-building before morning meetings or owner calls
- Outstanding balances are visible immediately, so follow-up happens faster
- Month-over-month trends surface without any additional calculation
- Decisions get made on current data, not data that is a week old
The outcome is less time spent assembling information and more time spent acting on it.
How does the dashboard fit into the broader Renter Insight platform?
The Property Dashboard is one part of a broader property management software platform designed for Manufactured Housing Parks, single-family, and multifamily portfolios. The same platform handles online rental applications, background screening with a Resident Risk Score, resident rent payments including CashPay, ACH, and credit card, auto late fees, maintenance requests, RUBS and utility billing, and native accounting with financial reports. For teams that already use QuickBooks, a direct integration is available. Everything is accessible through Android and iOS apps, and US-based phone, email, chat, and text support is included.
Frequently asked questions
What metrics are visible on the Property Dashboard?
The dashboard shows total units, occupancy rate, rent collected, and outstanding balances. Month-over-month changes are displayed alongside each metric so you can track trends without generating a separate report.
Is the dashboard data updated in real time?
Yes. The figures shown on the dashboard reflect your portfolio's current status the moment you log in, so there is no lag between what the software displays and what is actually happening in your properties.
What property types does Renter Insight support?
Renter Insight supports Manufactured Housing Parks, single-family rentals, and multifamily properties. The platform is built for management teams handling 50 or more units.
Does Renter Insight integrate with accounting tools?
Yes. Renter Insight includes native accounting and financial reports, and it also offers a QuickBooks integration for teams that prefer to manage their books there.
What support options are available?
Renter Insight provides US-based support through phone, email, chat, and text. Support is available to all customers and is not limited to a specific plan tier.
If you manage a portfolio of 50 or more units and want to stop piecing together performance data from multiple sources, visit Renter Insight's Property Dashboard overview to see the real-time view in action.